
Publishing a Geoprocessing Service and Web Application for Fish Sampling Locations Near Park Buildings at GEWA
Problem Description
National Park staff at the George Washington Birthplace National Monument (GEWA) needed to know which fish sampling locations were within practical reach of park buildings. With that information, they intended to plan shoreline access points, decide where to send staff and equipment, and spot sampling sites that are far from any infrastructure. Some of the staff may at the National Park did not have GIS experience, so the goal of this project was to turn a ModelBuilder workflow into a geoprocessing service and make it available in a public web application for staff of all technical skill levels. The resulting tool allowed users to choose a building and a buffer distance, and it returned the nearby fish sampling locations.
Analysis Procedures
For this analysis, all data was provided by the instructor. First, I built a geoprocessing tool in ArcGIS Pro which created a Graphic User Interface (GUI; Figure 1) from the workflow developed in ModelBuilder (Figure 2). I set the buffer distance, the expression, and the output as model parameters so users could change them from the web app.
Second, I published the model from ArcGIS Pro as a geoprocessing service on ArcGIS Server. The service ran asynchronously, and the outputs displayed through a map service. I set up each parameter’s input mode, description, and default value: a 200-meter buffer and feature = ‘Visitor Center’. I also published the park’s base and reference data as map and feature services. These included sampling locations, streams, buildings, small-scale features, fences, roads, the GEWA boundary, vegetation, and waterbodies. Third, in ArcGIS Experience Builder, I combined three things: the reference layers, the geoprocessing widget, and a query table that listed the building names. Lastly, I shared the application publicly.
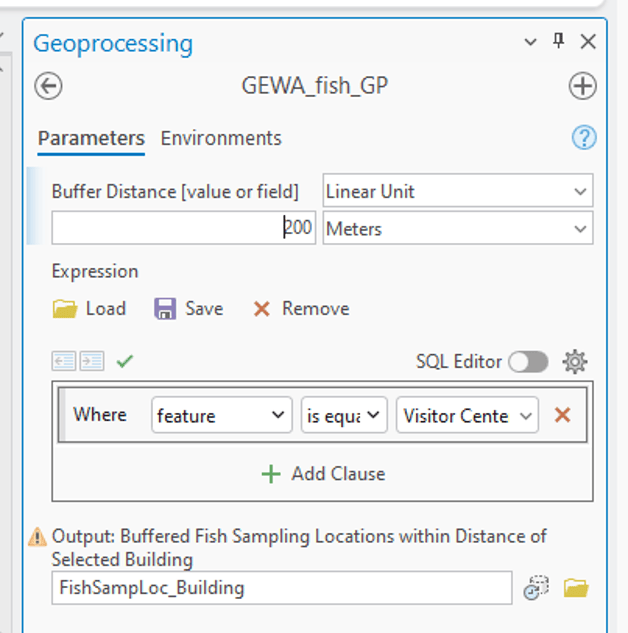
Figure 1. Geoprocessing Service GUI in ArcGIS Pro.
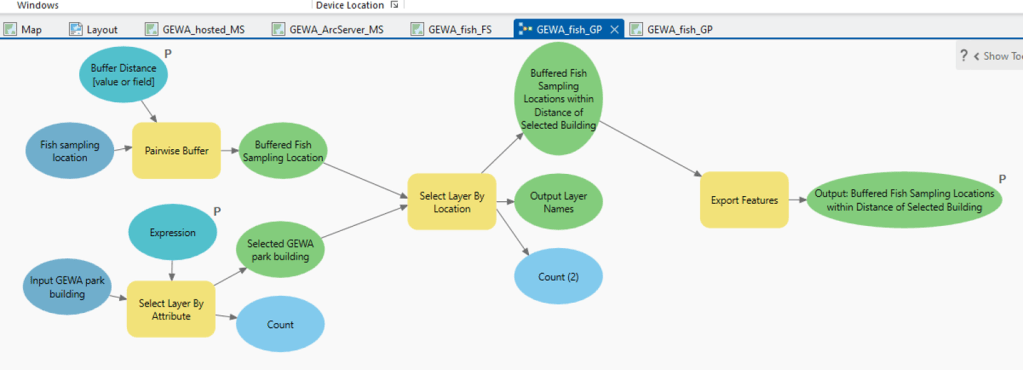
Figure 2. Screen capture of the ModelBuilder workflow for the geoprocessing service.
Results
The geoprocessing service ran on ArcGIS Server, and could also be viewed/access via the REST Services Directory. In the published web application, users could browse the park’s reference layers, enter a buffer distance and a building, and run the analysis. The app then mapped the buffered sampling locations within that distance of the chosen building (Figure 3).
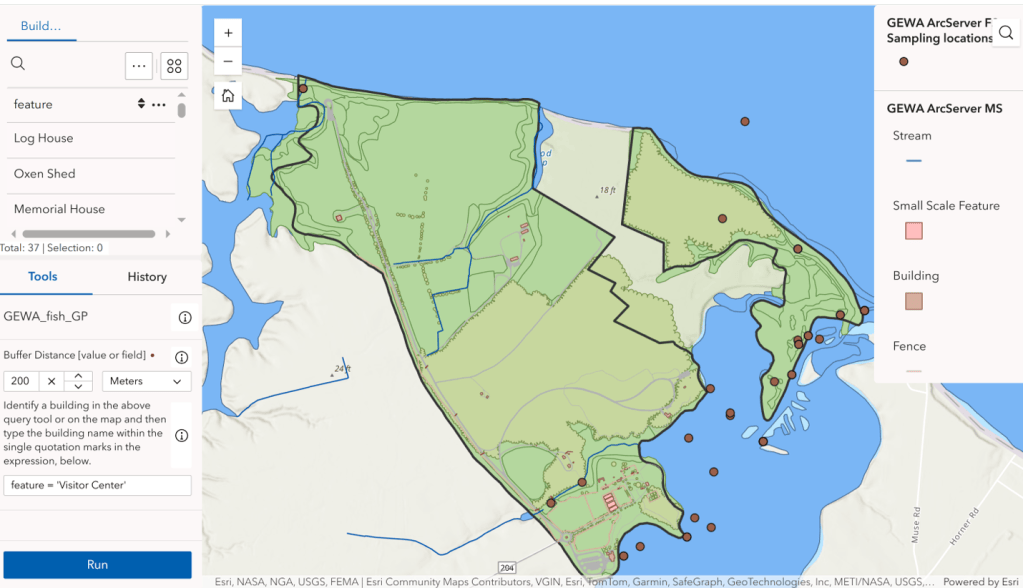
Figure 3. Screen capture of the web application with Geoprocessing Tool GUI.
Reflection
In this project, I developed a geoprocessing model in ModelBuilder and transformed it into a web-based tool that park staff could use without ArcGIS Pro or GIS experience. The biggest challenge was making the published service work the same way the model did in Pro. I designed the building input as a dropdown, but in the web app it appeared as a text expression that users had to type. I republished the service four times, rebuilt the model, and changed the parameter settings, including converting the expression’s data type to string. Unfortunately, the input still showed as text in the web app. After researching the issue, I found some documentation that suggested some input and output parameter types aren’t supported in web apps. As a workaround, I added a query table to the app so users could look up building names and type them into the expression in the geoprocessing tool GUI. This project challenged me because I had to think about how parameters behave across platforms, how services connect to an application, and how a non-GIS user will actually interact with tool interface. In the future, I know to check platform support for each parameter type before I design a model for publishing.
Publishing a Custom Geoprocessing Tool and Web Mapping Application for the New River Gorge National Park Project
Problem Description
For this project, the New River (NERI) Gorge National Park requested a user-friendly web application that would allow a user to propose their own power line and assess the surrounding environmental and cultural impacts. They wanted the final web tool to be public in order to be transparent about the effects of building a new power line. NERI specified that they needed the web application to be user-friendly for a general, non-academic audience. They requested that the web application include specific feature classes, allow users to add data in real-time to the underlying relational database system, and to include a custom geoprocessing tool that would allow a user to draw a line feature and choose a buffer distance around that line feature. Additionally, the number of site locations within the buffer needed to be identified so that a user could understand the vertebrates that affected by the proposed transmission line. Lastly, NERI shared that certain buildings are culturally significant to the national park, and in order to ensure their preservation, they needed to be included in the analysis and considered in the proposed project development.
Analysis Procedures
All project data were provided by the instructor and initially explored within a Microsoft (MS) Access database. I investigated table structures, variable definitions, field types, and relationships to understand the dataset. I created a UML diagram using Dia to represent the table relationships and included descriptive metadata for each variable based on the MS Access database. I created a new map project in ArcGIS Pro and configured an enterprise geodatabase. First, I established a connection using the SDE account, and then added and re-connected as a custom user account to ensure proper data placement. Next, I connected the enterprise database in pgAdmin. I generated and ran the DDL SQL statements to create table schemas and relationships for the database. Then, I used DDL SQL statements to populate the datasets in pgAdmin. I created maps in ArcGIS Pro to support the services needed for the functionality of the web mapping application and published them using ArcGIS Server (1:1 relationship between the map and the GIS service).
Then, I created a geoprocessing model that used the utility power lines feature service layer as an input, along with user-defined parameters for buffer distance and dissolve type (Figure 1). The tool generated a buffer around the input power lines using the “Pairwise Buffer” tool. This buffered output was then used as an intermediate dataset for two “Pairwise Clip” operations: one applied to the animal observations and another to the NERI building features. The model output two feature classes representing animal observations and buildings located within the specified buffer distance of the power lines (existing and proposed). These outputs were automatically added to the map for visualization and review. Following the GIS service publication, I created a web map in ArcGIS Online by adding the three services via REST endpoints. I configured the symbology, attribute display, and pop-ups to improve usability and published the web map.
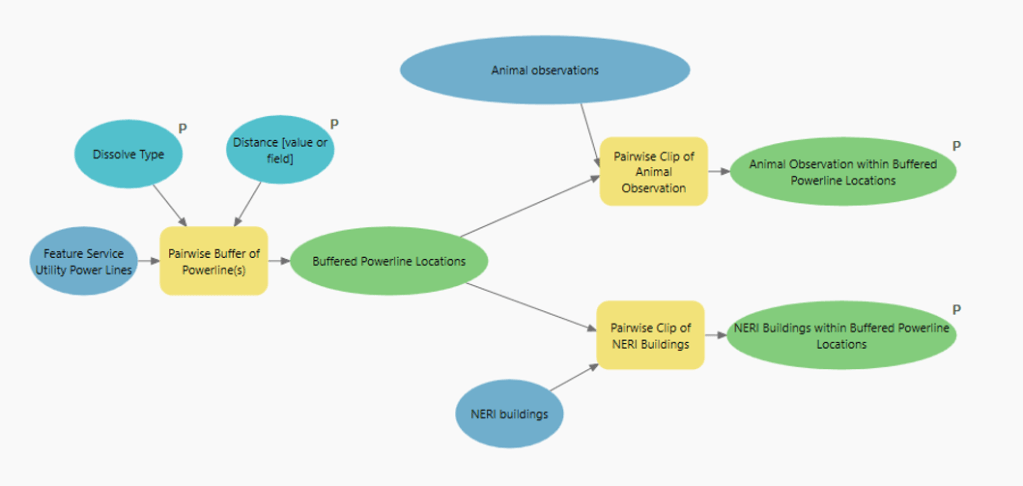
Figure 1. Screen capture of the ModelBuilder workflow for the geoprocessing service.
Results
The custom tool I developed was published as a geoprocessing service to ArcServer in order to be consumed in the web application. For the custom Experience Builder tool (Figure 2), I used a sidebar layout with accordion-style panels to organize the tools. This design allowed users to focus on the map and legend while accessing additional tools as needed. In the tool, when a user drew a new transmission line on the map, it is automatically saved in the database and could be used as input for the geoprocessing tool. This feature enabled users to run the tool not just on existing transmission lines, but on hypothetical transmission lines, allowing them to see potential impacts on the surrounding environment. This tool could be used to inform decisions about where to place transmission lines, and creating the automated tool allowed the user to try multiple variations of buffer distances and transmission line locations in an accessible web application.
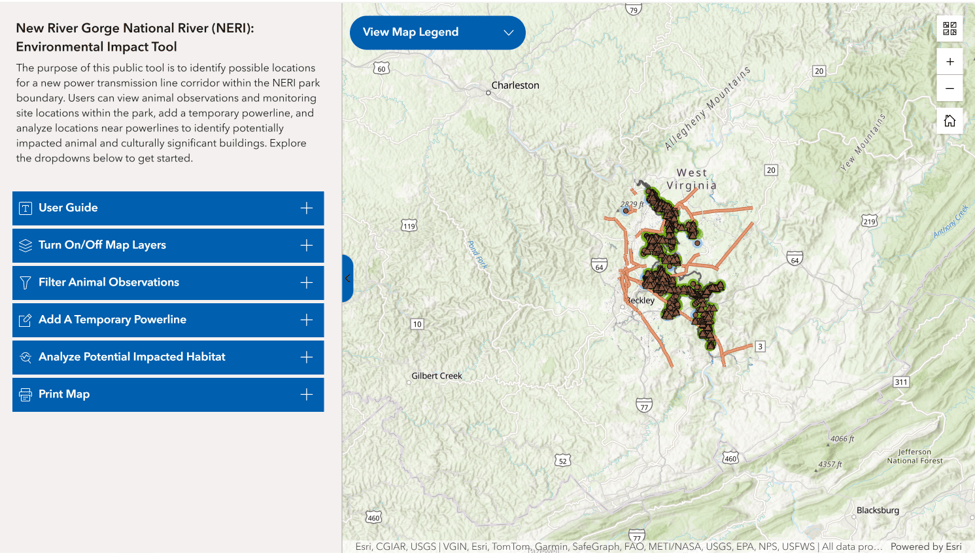
Figure 2. Screen capture of the final web application.
Reflection
Overall, the goal of this project was to create an enterprise database, publish GIS services, and develop a web-based mapping application that would allow the public to explore and interact with NERI spatial data. This project solidified my proficiency in developing and publishing web services (including geoprocessing services using ModelBuilder) and consuming the services in a web application. For this project, ModelBuilder served as a user-friendly way to build a custom geoprocessing workflow. This project also built my confidence in my ability to follow a complete workflow: 1) data exploration and database design, 2) enterprise geodatabase development and server management, 3) feature class preparation, 4) GIS services and geoprocessing, and 5) web map and app development. Additionally, the web application creation skills I gained from this project will be useful for many projects in the future, as they are highly transferrable.

